")

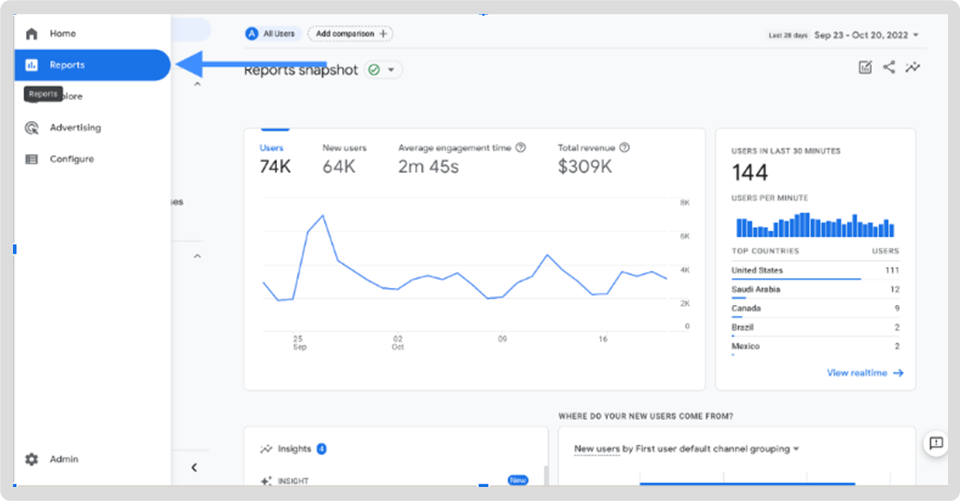
Photo credit – Google Analytics
In a data-first world, you need at-a-glance windows into various pockets of data that give you insights into various business functions, and even specific functions within a function like e-commerce marketing. With the right combination of dashboards, you should be able to spot customer behavior changes and problems (like slow site load times or glitches at checkout, for example), evaluate the performance of your e-commerce, and make fully informed decisions with ease and efficiency.
All of the above become possible because of an e-commerce analytics dashboard’s inherent benefits namely:
- Deliver an overview of metrics that matter to you
- Allow you to monitor multiple metrics at-a-glance
- Allow you to spot cause and effect or observe correlations between various metrics
In addition, dashboards also allow you to offer visibility to other stakeholders in your organization’s universe, like your C-suite, founders, investors, and any other powers that may be.
Although the actual number is probably even greater, data indicates that 5,692,209 companies use Google Analytics and that Google is the number 1 player in the data analytics space with 89.75% market share. It’s safe to say that you, and your competitors, and even your would-be competitors all use Google Analytics. The point is to use it well, and ensure that you extract maximum value
| Psst! If you’re new to Google Analytics dashboards, go through this Google resource to get acquainted with frequently used terminology and the location of various components. |
Let’s look at the top analytics dashboards and reports that any e-commerce marketer should be working with, regularly.
- E-commerce Overview Dashboard
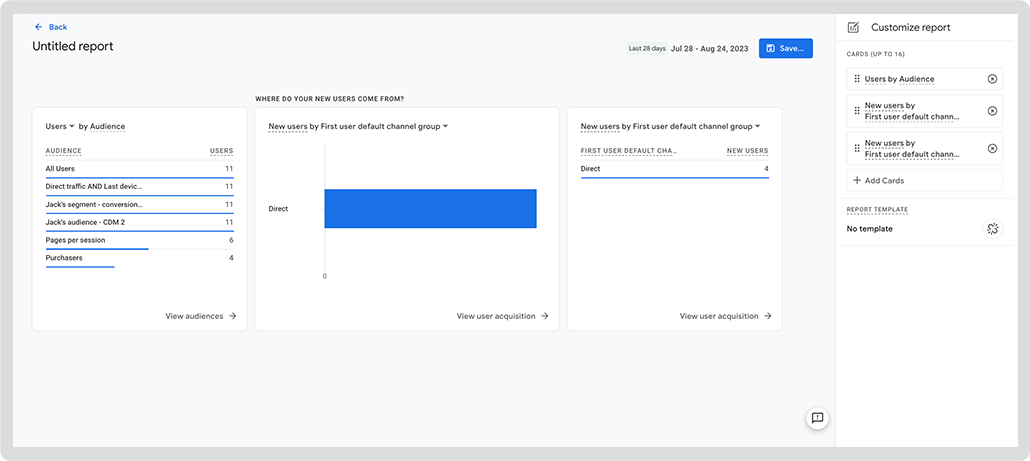
Photo credit – Google Analytics
This e-commerce analytics dashboard is a unified view of key performance metrics over defined periods. You get deep insights quickly and easily because it uses customized data visualizations. Moreover, as with most of the Google Analytics dashboards, you can choose exactly which metrics you want to monitor. This means that you measure and track only the numbers you and your stakeholders care about.
Popularly chosen metrics for the e-commerce overview dashboard include transactions, total revenue, revenue by channel, users, sessions, conversion rate, revenue per visitor, and average order value. These appear as up to 16 summary cards, which essentially sum up other reports in your stable of Google Analytics reports.
The idea is to reflect on these analytics to make data-backed improvements to your store or strategy.
For example, let’s say your revenue by channel data tells you that mobile search is gaining ground over desktop search. You might prioritize your mobile store when budgeting improvements, and invest more heavily in mobile search.
Use this Google resource to get started with your e-commerce overview dashboard.
2. Audience Overview Dashboard
As the name suggests, the Google Analytics Audience Overview report provides essential insights into your audience’s behavior. This e-commerce metrics dashboard lets you look at metrics such as users, sessions, bounce rate, and average session duration. User data would include details like demographics, interests, and geographic locations. These details help you make data-driven decisions that increase traffic and conversions.
You would, for instance, modify your targeted ads spend allocation based on where your customers are concentrated, geographically, or what their interests are. And that’s just user data.
Each of the metrics offers similarly critical insights. Bounce rate, for instance, tells you what areas of your site to optimize. Average session duration clues you into what pages your audience is most interested in.
Use this Google resource to get started with your audience overview dashboard.
3. E-commerce Purchases Report
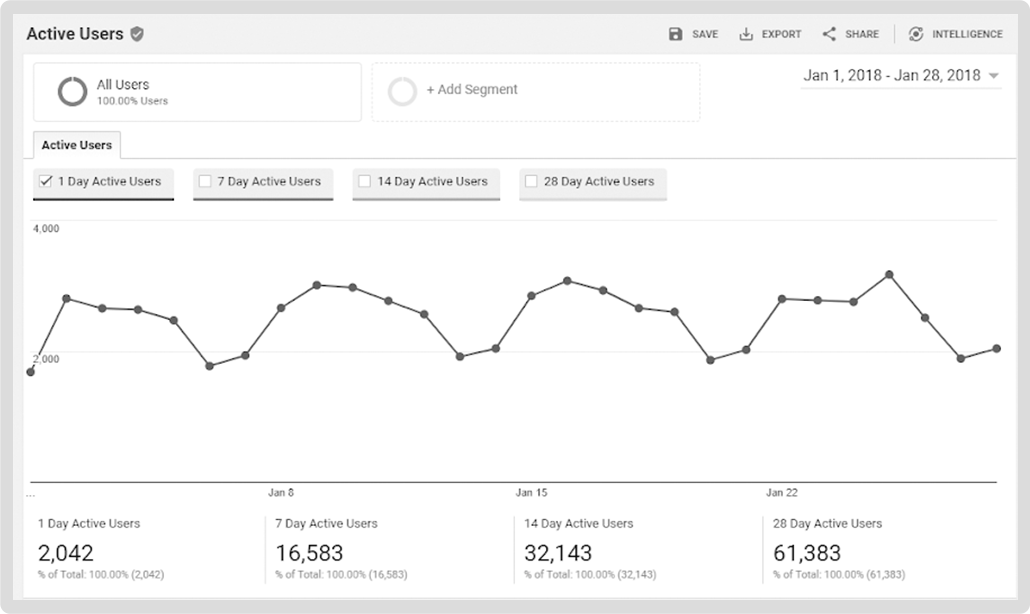
Photo credit – Google Analytics
This Google Analytics e-commerce dashboard tells much more than your total purchases and the categories and item codes, etc, associated with purchases. You also get insights into the revenue from various items including items viewed and added to cart, and your most active shoppers.
These metrics deliver a fairly vivid picture of your e-commerce store’s health. If you can see periodic improvement in purchases and activity, you know you’re doing things right. Meanwhile, lots of views, with low purchase numbers might direct you to look at competitiveness of pricing, delivery charges and timelines, and your checkout process. You might also want to tap into these metrics after an ad campaign or during a discount period, to observe how numbers are responding.
Use this Google resource to get started.
4. Purchase Journey Report
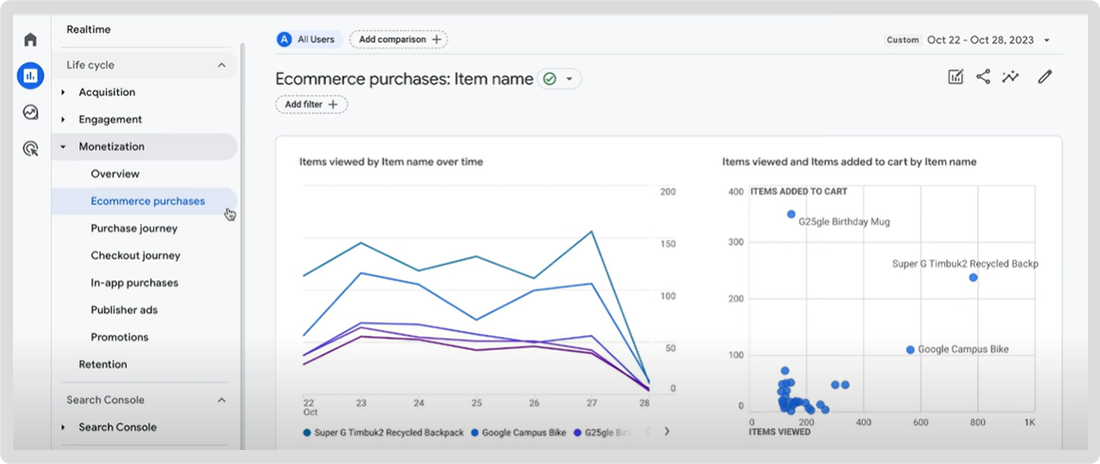
Photo credit – Google Analytics
Use this Google Analytics e-commerce dashboard report to track user drop-offs at each step of your buyer’s funnel, to identify areas that need improvement. With provides detailed insights into user behavior, highlighting potential issues like high shipping costs or broken links that may hinder conversions. By understanding where users abandon the funnel, you can make targeted adjustments to improve the user experience.
E-commerce businesses commonly check if there is a spike in users dropping off between beginning checkout and purchasing, as this might hint at users being dissatisfied with shipping costs or delivery charges, or that the site glitches at this point
Use this Google resource to generate your purchase journey report.
5. Acquisition Overview Report
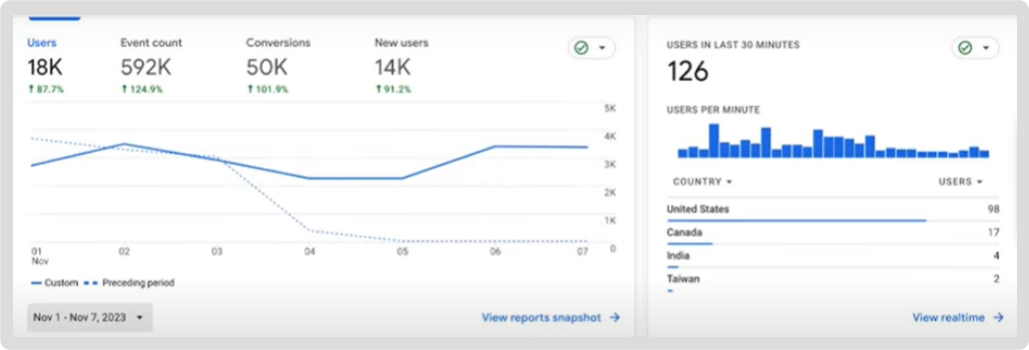
Photo credit – Google Analytics
This e-commerce metrics dashboard helps you identify your most valuable customers in real-time, and track the success of your marketing efforts. The idea is to apply these insights to improve the performance of content marketing efforts. You can opt for summary cards like “users in the last 30 minutes” and new sessions to the channel (web or app) you have designated as your default channel, not to mention track new sessions to your website or mobile app categorized by Google Ads campaign.
Use this Google resource to dive into your acquisition data.
6. Social Media Report
This report by Google Analytics doesn’t come ready-made for your e-commerce site, but you can get social media data from the traffic acquisition report that you can find under analytics> traffic in Reports. The default report already provides information about traffic coming in from organic visitors vs paid social media activities designed to drive visitors to your e-commerce site. However, you can also find visitors by channel in just a few clicks by creating a custom report.
Use this step-by-step resource to find out how to get started with custom reports, and this quick guide to create a custom social media report.
Beyond Google Analytics: Get deep insights from integrations-led data
Google Analytics is a treasure trove of analytics for your e-commerce website, but it’s not the only source of data insights you have at your disposal. Several of the apps that integrate with your store can offer insights that help you improve your messaging and overall approach to marketing. Here’s a list of apps that can give you customized, in-depth data when integrated:
Tapcart
Data delivered — Live data about what’s happening on your e-commerce app.
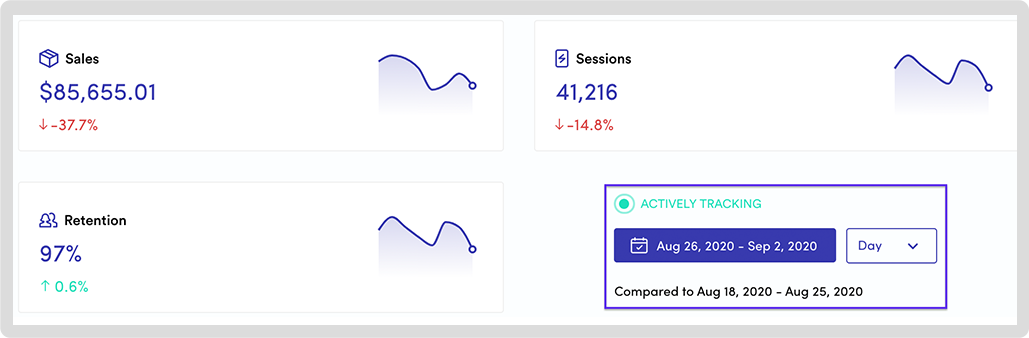
With Tapcart data, you can compare sales, sessions and more for a given period against data for another period. This data helps you monitor your store through the year, and also helps you zero in on the impact of ad campaigns, sales, collaborations and promotions on actual numbers.
Pro Tip: Double your intelligence by connecting Tapcart with Firebase, Google’s app development platform. Learn how to do this here.
Klaviyo
Data delivered — Everything about your email and SMS campaigns run on its platform.
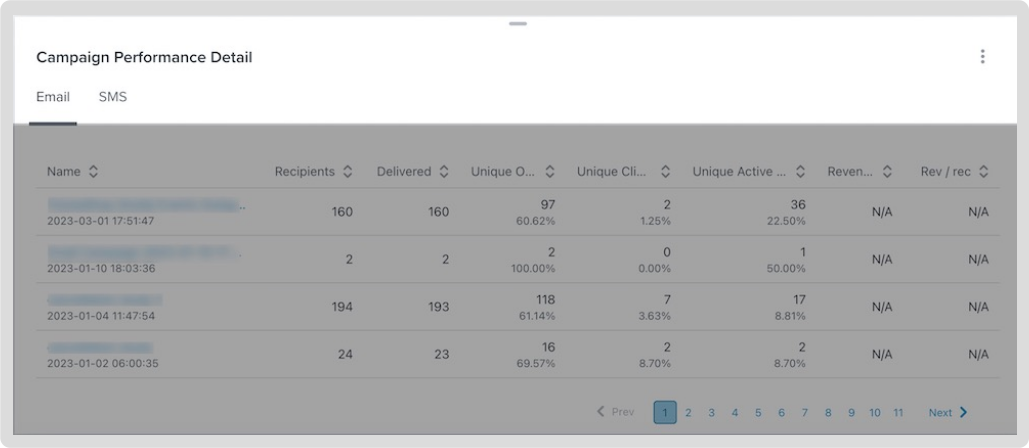
With your Klaviyo data, you can identify best performing channels, campaigns, flows and forms and compare these to their more recent counterparts (like comparing your best converting sale flow to a recent flow around an influencer collaboration). You calso get data on leading and lagging metrics around email and SMS, deliverability rates (and info on anything that needs fixing here). Your Klaviyo dashboard event ells you where customers fall off email and SMS funnels.
Learn more about Klaviyo dashboards here
Semrush
Data delivered — Everything that makes your site more easily discoverable.

With your Semrush data, you can audit your e-commerce site to correct meta information and make your content more search-friendly. You also get backlink ideas, keywords to optimize for (including the ones your comp set is targetting). You can track SEO metrics track positions on a daily basis, and keep an eye on competitors who rank with your keywords.
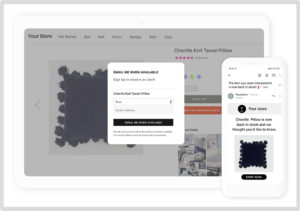
Swym
Data delivered — Customer preference intel like wishlisted items and back-in-stock requests.
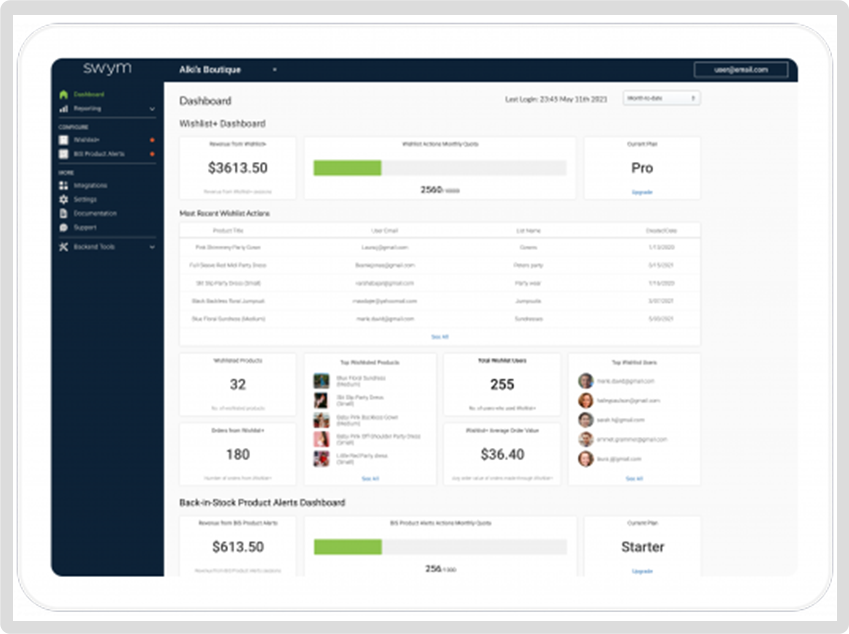
With your Swym data you can tailor marketing campaigns and customer engagement experiences to reflect preferences expressed when they wishlist products or request restock notifications. This means that you feature imagery and content that reflect their tastes and preferences. Swym integrates with popular email marketing platforms like Klaviyos, widely used social marketing platforms like Meta, and engagement platforms like Optimizely (among countless other integrations) to help you use Swym’s data to improve your customer experience, conversions and the overall performance of your e-commerce store. (For instance, over and above helping you to market better, back-in-stock data might also offer inventory-related insights).
Which Dashboard Should You Dive Into First?
The truth is, you’ve got a limited number of hours in a day, and therefore cannot track all these dashboards daily. However, you can select a mix of Google Analytics e-commerce dashboards and other relevant dashboards for daily monitoring. Designate others for weekly tracking, and earmark still others for regular, but less frequent oversight.
Choosing — or rather prioritizing — the right mix of dashboards should be based on two factors:
1) The most burning issues you aim to fix or the most immediate goals you want to pursue, and
2) The metrics and data necessary to achieve those goals or fixes.
Start making dashboard-driven decisions today, and watch the difference.